Howdy folks 👋
❌🚀 Last week's article wasn't rocket science — we covered Euclidean's formula for determining the distance between two points in 2D space:
📏 I'd like to make a quick clarification in case it wasn't obvious in last week's newsletter.
A centroid (center) of a ball can be thought of as the North Pole.
American Bocce Co measures from the Belly of the Bocce to the Edge (Equator) of the Pallino with a measuring tape at our leagues. They've found that this is the least error-prone way of measuring and is the same standard the Special Olympics uses.
Oftentimes people who have never refereed before are tempted to measure Equator-to-Equator in which it is more likely that you might bump a ball and it is more likely that you need two people to make the measurement.
For this computer vision project, measurements are from the North Pole of the Bocce to the North Pole of the Pallino -- a little different than either method described above. The centroid of either ball is the North Pole.
North Pole-to-North Pole is longer than either Equator-to-Equator or Belly-to-Equator.
While computer vision can easily find the North Pole of the ball, it is unlikely that a human would make an accurate measurement between two North Poles with a tape measure.
With that out of the way...
What about determining which Bocce ball is which? Who is red, who is blue? Who is home, who is away? Who is the fancy green and black stripes and who is the purple with magenta stars?
Today we're going to dive into the challenge of distinguishing between bocce balls. Spoiler — it is more challenging than it looks.
Welcome to the 4 new subscribers this week! If you are new, be sure to read my bocce stats article.
The culture of bringing your own Bocce Balls
In competitive bocce, teams bring their own unique bocce balls.
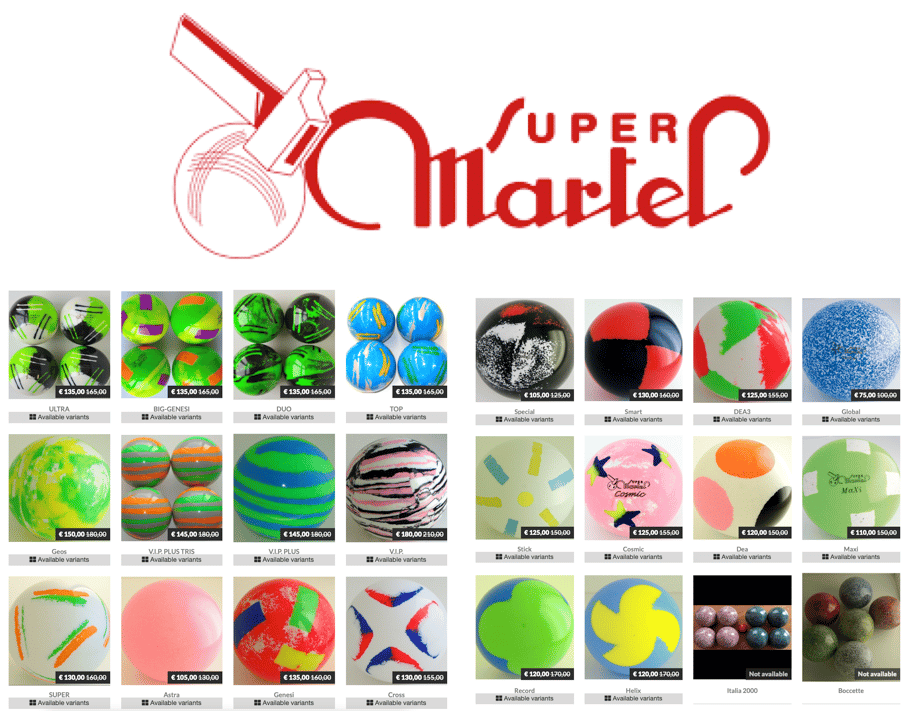
Super Martel makes some of the finest bocce balls on the planet from their production facility in 🇮🇹Italy. You can order many different pattern and color combos.
It's not unlike bowling. In bowling a player has their preferred ball diameter, ball weight, hole pattern, hole size, and color.
In Bocce, we can choose our color/pattern. But the difference in Bocce is that the ball diameter and weight is regulated by the tournament — everyone must use the same size and weight. A standard I'm familiar with is 107mm in diameter, 920 grams in weight.
Most competition balls have a fun and unique color pattern. Super Martel has so many options, it is unlikely that any two teams out of a tournament of 128 will have identical balls. Balls sets might have similar colors but different patterns or vice versa. So how do we account for the pattern when distinguishing between balls using computer vision?
Distinguishing Between Multi-Color Patterned Bocce Balls

One way to distinguish between two different ball patterns is with a supervised AI image classifier with two options BallA/BallB.
"Supervised" means that training the AI is required. Training requires about 100-500 images of each ball, which is time consuming and needs to happen before the game starts. While this method may be ideal (a system like this is intelligent and highly accurate), it isn't practical for a tournament where time is limited.
Is there an "unsupervised" (no training required) option that doesn't require training? Yes! It performs nearly as well, but from my testing it might not be adequate.
Let's dive into Color Histogram k-Means Clustering.
A Few Computer Vision Definitions
👉 You can skip this section and refer back to it as necessary.
My wife and editor, Elizabeth, suggested that I write these definitions more simply. I've provided a link if you wish to explore more.
Here are those image processing and machine learning definitions in my own words:
Color Histogram: Numbers that represent the distribution of colors (color profile) in an image. -- source: Wikipedia
Feature Vector: A long list of numbers which can describe something complex. -- source: Brilliant.org
K-Means Clustering: An "unsupervised" (no learning) algorithm which groups together similar feature vectors. -- source: Wikipedia
Here's the color histogram (right) of a color image (left):

Image Source: OpenCV Image Histograms (cv.calcHist) - PyImageSearch
The graph's x-axis goes from 0 to 255 because an RGB (Red-Green-Blue) pixel is represented by a 3-tuple in that range. As an example, a pixel's color components might be RGB=(240, 100, 34) or mostly red, some green, and not much blue.
The graph on the right counts the number of pixels with each color-component value.
If you notice that the picture has quite a lot of blue (sky and water) and then look at the color histogram, the far right indicates a lot of blue pixels.
To create a feature vector from the color histogram, we simply concatenate the list of numbers together. In this case there would be 256 numbers for Red, 256 numbers for Blue, and 256 numbers for Green resulting in a feature vector with 256+256+256=768 numbers where we say the FV is 768-D (dimensionality).
Oftentimes histograms are "binned" (counted in groups) to reduce the granularity of the feature vector (fewer numbers can help us optimize speed). So instead of counting all values in the range 0-255 we break up the 256 options into bins such as 8 bins. Effectively this shortens the color histogram feature vector length to 256/8 + 256/8 + 256/8 = 32 + 32 + 32 = 96 or 96-D.
Bocce typically is played 4x teamA Bocce balls, 4x teamB Bocce balls and 1x Pallino. So we need to distinguish between teamA and teamB balls. There will be two clusters of balls if we were to represent feature vectors graphically (three in this visualization):

The k-Means seeks to group together close feature vectors. Interestingly, it uses Euclidean's formula (discussed last week) albeit in higher dimensions.
👉 Long story short — we aren't simply looking for a single color for a ball. We're looking at all the colors of your fancy patterned multicolored ball and we're comparing it to other color profiles of balls.
Bocce Ball Color Histogram k-Means
The flow for this algorithm is as follows:
Identify Ball Region of Interest (ROI) (visit my previous newsletter if you want to learn how we're doing that)
Extract the Ball circle region
Determine the binned color histogram feature vector for each ball
Run the k-NN algorithm with a setting for 2 clusters
Label teamA and teamB balls
Note: As you look at the algorithm, you might be wondering what we'll do when only 1 Bocce ball is present on the court. In the case we simply compare the k-NN result to previous results in the game. In other words, when the game starts we won't initially know the two clusters unless we use data from a previous game in which the same balls were used. Luckily we can grab enough data to make the clusters during practice.
Lab Reports
Well, did it work ❓
Unfortunately no 🤬.
Remember those clusters in that image above? Effectively the clusters weren't always distinguishable for patterned balls. I'd say it was working for about 40% of the samples and if I display the result here it will look really whacky. So whacky that at first I thought I had a bug in my code.
🧠 My patterned balls are very distinguishable to the human brain:

But consider the algorithm we employed — it is based on color only! For my beautiful balls that means:
LEFT: Blue, Yellow
RIGHT: Blue, Yellow, Black
There just isn't enough of a difference in color for kMeans to distinguish the feature vectors. My hypothesis for this color histogram k-Means clustering may not be adequate long term.
In short, we can't ignore the pattern. To distinguish the pattern, we need to employ an AI algorithm known as a Convolutional Neural Network (CNN) — a supervised learning algorithm. AI will require data tagging and training, so hopefully I can come up with a quick way to do this.
Until we cross that bridge, here's the color histogram k-Means clustering result for solid colored balls:

Notice how it consistently maps blue to blue and red to red. As you can see the balls wiggle/jitter quite a bit in the drawing at the bottom of the above animation. The "jitters" are easy to fix with a data smoothing algorithm. I will cover that in an upcoming article.
And I couldn't help myself to drop the algo into more of the system.

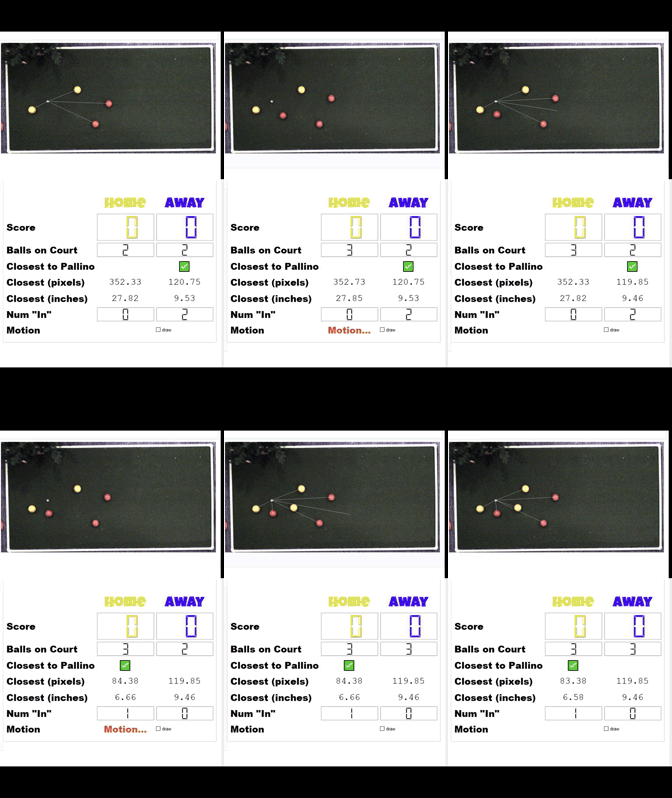
This is proof that my intra-frame scoring system is more than partially working. It is working. There are a more than a few kinks to work out, namely (1) I shouldn't give off the false impression that measurements are accurate to two digits past the decimal (2) I should let data stabilize before displaying it.
Do you want to watch bocce on TV?
📺 Be sure to like & subscribe to The Bocce Bros and Bocce Broadcast Network on YouTube.
Then stream it with your Apple TV or Roku in your living room.
Maybe one day some of the tech I'm working on can give the commentators some stats to chat about.
Distribute Digital Dreams!
Help me connect with more folks.
Via email replies each week, I've received words of encouragement, words of doubt, ideas, calls for collaboration, and more. Each of these new connections motivate me to continue to build and write.
In the section below, you'll see a personalized affiliate/referral link unique to you.
I'm asking for you to text/email that link to your 3 other bocce teammates. It'll only take you 29 seconds to copy/paste it to the group text (that you already have) with your Wednesday night bocce team.
Or maybe drop it into social media and let Facebook, Instagram, and Twitter work their magic.
If you help me spread the word, I'll reward you with some swag. Think: pins, koozies, stickers, t-shirts, and more. I've already got a pack of pins in stock that is eager to be stuck somewhere.
Thanks for reading!
I'll be back next week with another Bocce Labs newsletter. And I'm just a ring, ping, or ding away if you want to chat (just smash the reply button).
~ Digital Dave


